The most common claim denial reasons are missing or inaccurate claim data, authorization problems, incomplete patient information, coding errors and non-covered services, based on provider surveys and federal marketplace reporting.
Denial rates and “top reasons” depend on who you ask. Provider surveys measure what billers see in their queues. Federal marketplace data measure what HealthCare.gov insurers report to CMS. Medicare contractors publish their own top CARC/RARC pairings. This guide quotes each source as published and then maps the usual reasons to the denial-code pages on this site.
Key Takeaways – In Experian Health’s 2025 State of Claims survey, 41% of providers said 10% or more of their claims were denied (up from 38% in 2024 and 30% in 2022). – Experian Health’s 2024 survey ranked the top denial triggers as missing or inaccurate data, authorizations, and inaccurate or incomplete patient information. – KFF’s analysis of CMS Transparency in Coverage data found HealthCare.gov insurers denied 19% of in-network claims in 2024 (about 85 million of 451 million). – On Medicare remittances, the same problems show up as specific codes such as CO-16, MA130, CO-197, CO-50, OA-18 and CO-29. The tables below link each one. – Figures below are quoted from the named publisher for the year shown. We do not invent or average them into a single national ranking.
How this guide was checked: every percentage links to Experian Health’s own summary, KFF’s 2024 marketplace analysis of CMS data, or a Medicare contractor page. Last reviewed: 5 October 2026.
Table of Contents
What the data actually measures
Three kinds of sources appear in denial discussions. They answer different questions.
| Source type | What it measures | Example used here |
|---|---|---|
| Provider survey | Share of providers who report a given denial rate or reason | Experian Health State of Claims (2024, 2025) |
| Insurer transparency data | Share of claims HealthCare.gov insurers report as denied | KFF analysis of CMS data for plan year 2024 |
| Medicare contractor lists | Which CARC/RARC pairings a MAC saw most often in a published quarter | Noridian and Novitas top-denial pages cited on our code guides |
A survey percentage is not the same as a claims denial rate. When Experian says 41% of providers report that 10% or more of claims are denied, that is a share of respondents, not a national paid-claims rate. KFF’s 19% figure is a share of reported in-network claims. Keep the units straight when you compare them.
How often claims are denied
Provider view (Experian Health)
According to Experian Health’s State of Claims 2025 blog summary, which describes a survey of 250 healthcare professionals fielded in June–July 2025:
- 41% of providers said their claims are denied over 10% of the time in 2025.
- The same series was 38% in 2024 and 30% in 2022.
Becker’s Hospital Review, summarizing Experian’s 2024 report (survey of 210 staff, 22 June–10 July 2024), also reported that 38% of respondents said claims are denied 10% of the time or more, and 11% said more than 15% of the time.
Marketplace view (KFF / CMS)
The KFF analysis of CMS Transparency in Coverage data for 2024 found that HealthCare.gov insurers:
- received about 496 million claims in 2024;
- denied 19% of in-network claims (about 85 million of 451 million);
- denied 37% of out-of-network claims;
- averaged 20% across all claims.
In-network denial rates by insurer ranged from 3% to 36%. Consumers appealed fewer than 1% of denied in-network claims; insurers upheld 66% of those internal appeals.
What we are not claiming
There is no single official “national denial rate” for all US medical claims. Commercial, Medicare, Medicaid and marketplace books of business differ. We quote each source’s own figure and year rather than blending them.
Most common reasons, by source
Experian Health (provider survey)
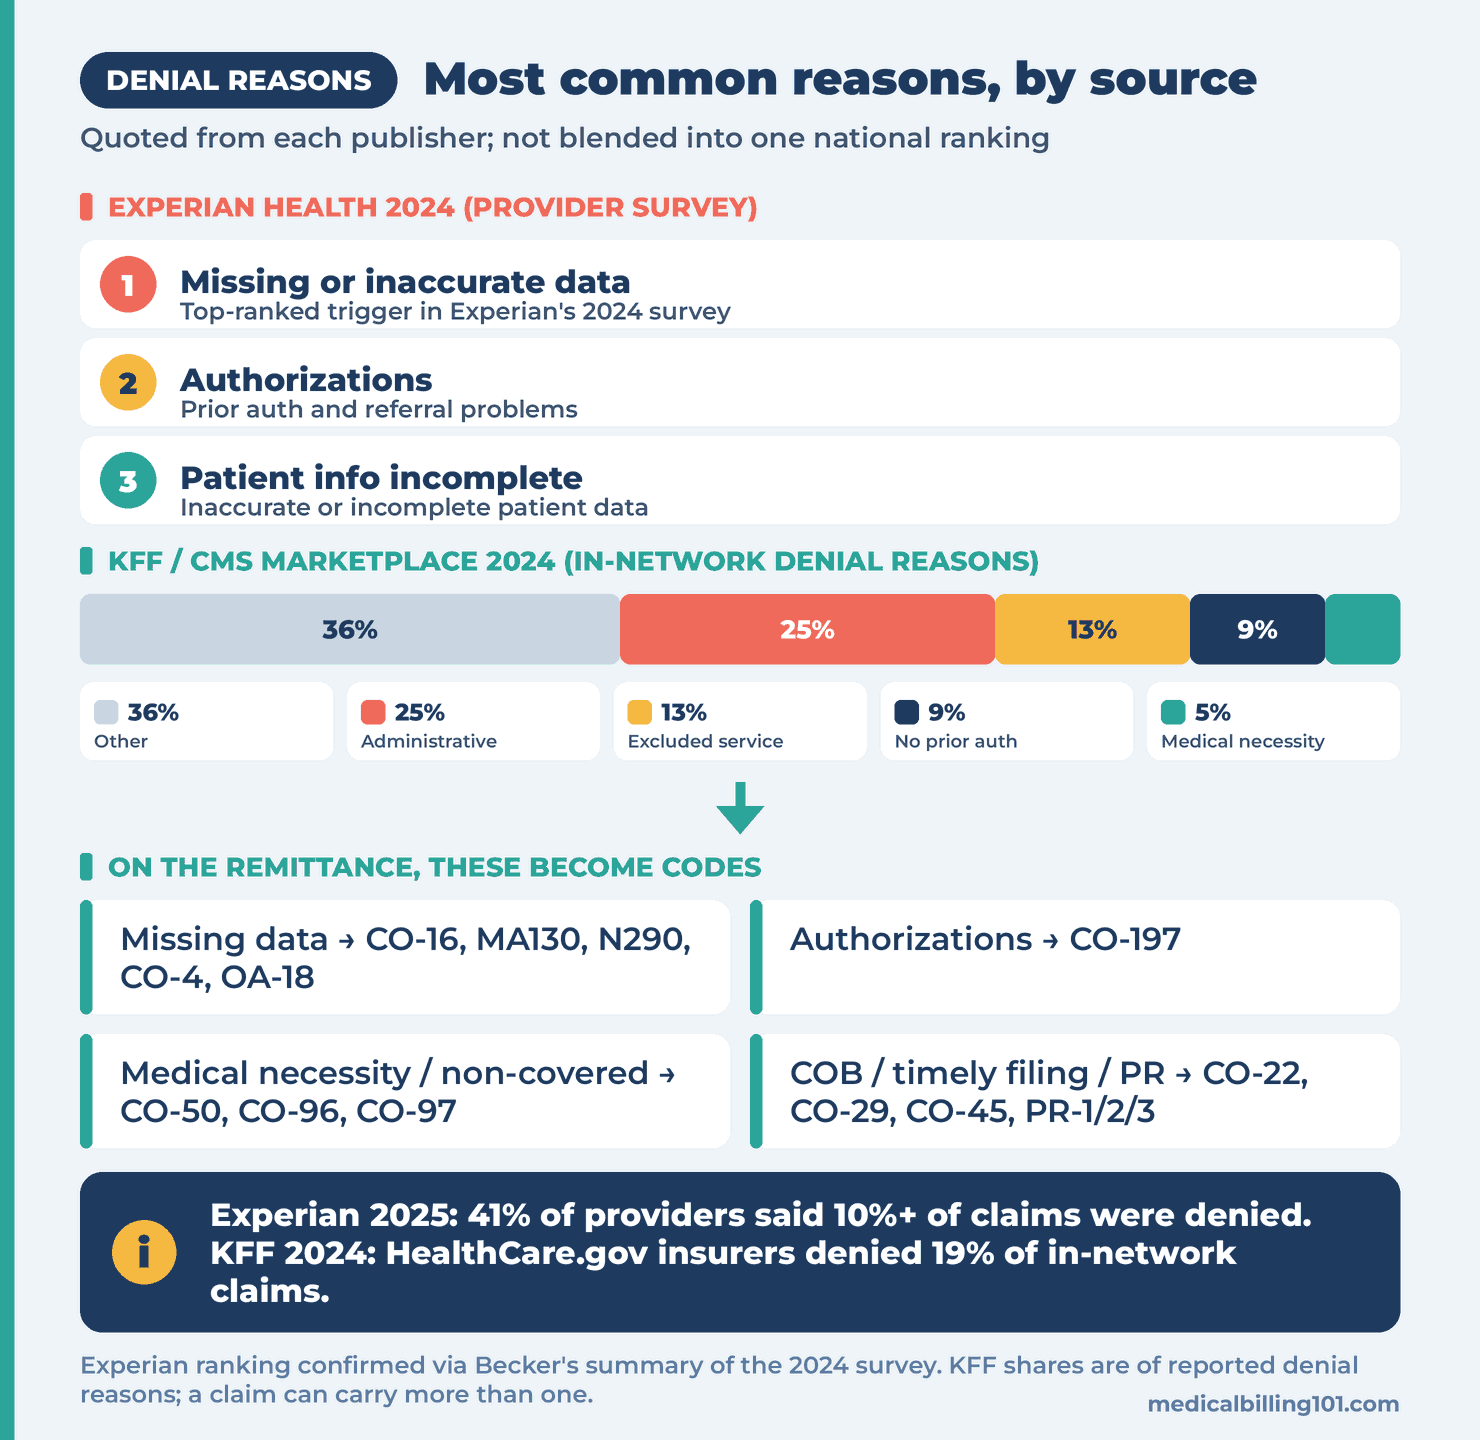
For 2024, Becker’s reported Experian’s ranked top reasons as:
- Missing or inaccurate data
- Authorizations
- Patient information inaccurate or incomplete
Experian’s 2025 blog states that rankings for primary denial triggers were unchanged from 2024 to 2025, while some percentages changed. We cite the 2024 ranking above because that is the list confirmed in a secondary report that quotes the survey. We do not reproduce 2025 percentage shares here, because we could not retrieve Experian’s 2025 PDF behind its download wall at the time of writing.
KFF / CMS marketplace denial reasons (2024)
Of the in-network denial reasons HealthCare.gov insurers reported for 2024, KFF’s table shows:
| Reported reason | Share of reported denial reasons |
|---|---|
| “Other” (reason not listed) | 36% |
| Administrative reasons (duplicates, missing information, untimely, unapproved provider, and similar) | 25% |
| Excluded service | 13% |
| Lack of prior authorization or referral | 9% |
| Medical necessity | 5% |
KFF notes that a claim can carry more than one reason, that “other” is large, and that the public file does not show which services were denied. Treat the table as the insurers’ reported category mix, not a clinical ranking.
Medicare contractor “top denials”
MACs publish quarterly or periodic lists of frequent CARC/RARC combinations. Those lists change by contractor and quarter. On our guides we cite, for example:
- Noridian and Novitas listing CO-50 with N115 among recent top claim denials (medical necessity / LCD);
- Noridian and First Coast guidance on MA130 / unprocessable returns;
- contractor pages for CO-16, OA-18, CO-22 and CO-29.
Use your own MAC’s current top-denial page for local priorities (for example Noridian’s denial resolution or Novitas top claim denials). Our denial codes hub collects the code-level fixes.
Mapping common reasons to denial codes
The labels above are categories. On a remittance they appear as group code + CARC + RARC from the X12 code lists. Use this map to jump to the fix.
Missing or inaccurate claim data / administrative issues
| What you see | Typical codes | Guide |
|---|---|---|
| Claim lacks information or has a billing error | CO-16 | Fix the missing field and resubmit |
| Unprocessable claim; no appeal rights | MA130 | Correct and send a new claim |
| Missing or invalid rendering provider NPI | N290 (often with CO-16) | Fix the rendering NPI / enrollment link |
| Procedure / modifier mismatch | CO-4 | Correct the modifier or code pair |
| Exact duplicate | OA-18 | Confirm the original claim status before rebilling |
Authorizations and referrals
| What you see | Typical codes | Guide |
|---|---|---|
| Precertification / authorization absent | CO-197 | Check auth number, dates, NPI and procedure match |
Also see our prior authorization checklist for surgical procedures.
Coverage, medical necessity and non-covered services
| What you see | Typical codes | Guide |
|---|---|---|
| Not medically necessary | CO-50 (often N115 / N386) | Match diagnosis and documentation to the LCD, NCD or plan policy |
| Non-covered charges | CO-96 | Confirm coverage; do not balance-bill a CO write-off |
| Bundled / integral to another service | CO-97 | Check NCCI PTP and modifier rules |
For documentation that supports medical necessity, see what payers actually look for in the medical necessity documentation guide.
Coordination of benefits, timely filing and patient share
| What you see | Typical codes | Guide |
|---|---|---|
| Another payer may be primary | CO-22 | Fix COB order; bill primary first |
| Filing limit expired | CO-29 | Check the payer’s limit and any exception |
| Charge exceeds fee schedule / allowed amount | CO-45 | Usually contractual, not a clinical denial |
| Deductible, coinsurance, copay | PR-1, PR-2, PR-3 | Patient responsibility, not a provider write-off |
How to use these lists in your RCM workflow
- Pull your own top 10 CARCs for the last quarter, by payer. National surveys set expectations; your remittance file sets priorities.
- Split unprocessable returns from true denials. MA130 / CO-16 style returns need a corrected new claim, not an appeal. True denials may need a reopening, a corrected claim or a formal appeal. See how to appeal a denied Medicare claim.
- Attack the front end for data and auth issues. Missing data and authorization problems dominate provider surveys. Registration edits, eligibility checks and auth matching prevent more dollars than post-denial appeals.
- Keep a code-level playbook. Link each high-volume CARC to a checklist (our hub is built for that) and to the payer policy or LCD behind it.
- Watch the calendar. Timely filing (CO-29) turns a fixable denial into a write-off.
Frequently asked questions
What is the most common reason claims are denied? In Experian Health’s 2024 provider survey, the top-ranked trigger was missing or inaccurate data, followed by authorizations and incomplete patient information. In KFF’s 2024 marketplace analysis, the largest reported reason categories were “other” (36%) and administrative reasons (25%). The answer depends on the dataset.
What percent of claims are denied? There is no single national rate. Experian Health (2025) reported that 41% of surveyed providers said 10% or more of their claims were denied. KFF found HealthCare.gov insurers denied 19% of in-network claims in 2024. Quote the source that matches the population you care about.
Which denial codes should billing teams learn first? Start with CO-16, MA130, CO-50, OA-18, CO-22, CO-29, CO-4, CO-197, CO-97 and the PR patient-responsibility codes linked in the tables above. Then add the codes that dominate your remittances.
Are contractual adjustments the same as denials? Not always. CO-45 (charge exceeds the fee schedule or contracted amount) and PR-1 / PR-2 / PR-3 often reflect allowed amounts and patient share, not a clinical refusal to cover the service. Read the group code before you appeal.
Where do I look up a specific denial code? Use our denial codes list (linked above) for official X12 wording and step-by-step fixes.
Sources
- Experian Health, State of Claims 2025 (blog summary)
- Experian Health, State of Claims report landing page
- Becker’s Hospital Review, summary of Experian Health 2024 State of Claims (26 September 2024)
- KFF, Claims Denials and Appeals in ACA Marketplace Plans in 2024
- X12 Claim Adjustment Reason Codes
- X12 Remittance Advice Remark Codes
- Novitas JL, Top claim denials
- Noridian JE Part B, Denial resolution / reason code guidance
Last reviewed: 5 October 2026 · Educational only. Survey and transparency figures describe the populations those publishers measured; your denial mix will differ.

Manikandan is a Revenue Cycle Management (RCM) specialist with over 10 years of hands-on experience in US healthcare billing. He has worked extensively with commercial payers, Medicare, and Medicaid across multiple specialties including surgery, orthopedics, and radiology. Manikandan founded Medical Billing 101 to provide free, accurate denial code guides, CPT coding references, and Medicare billing resources for US medical billing professionals.