
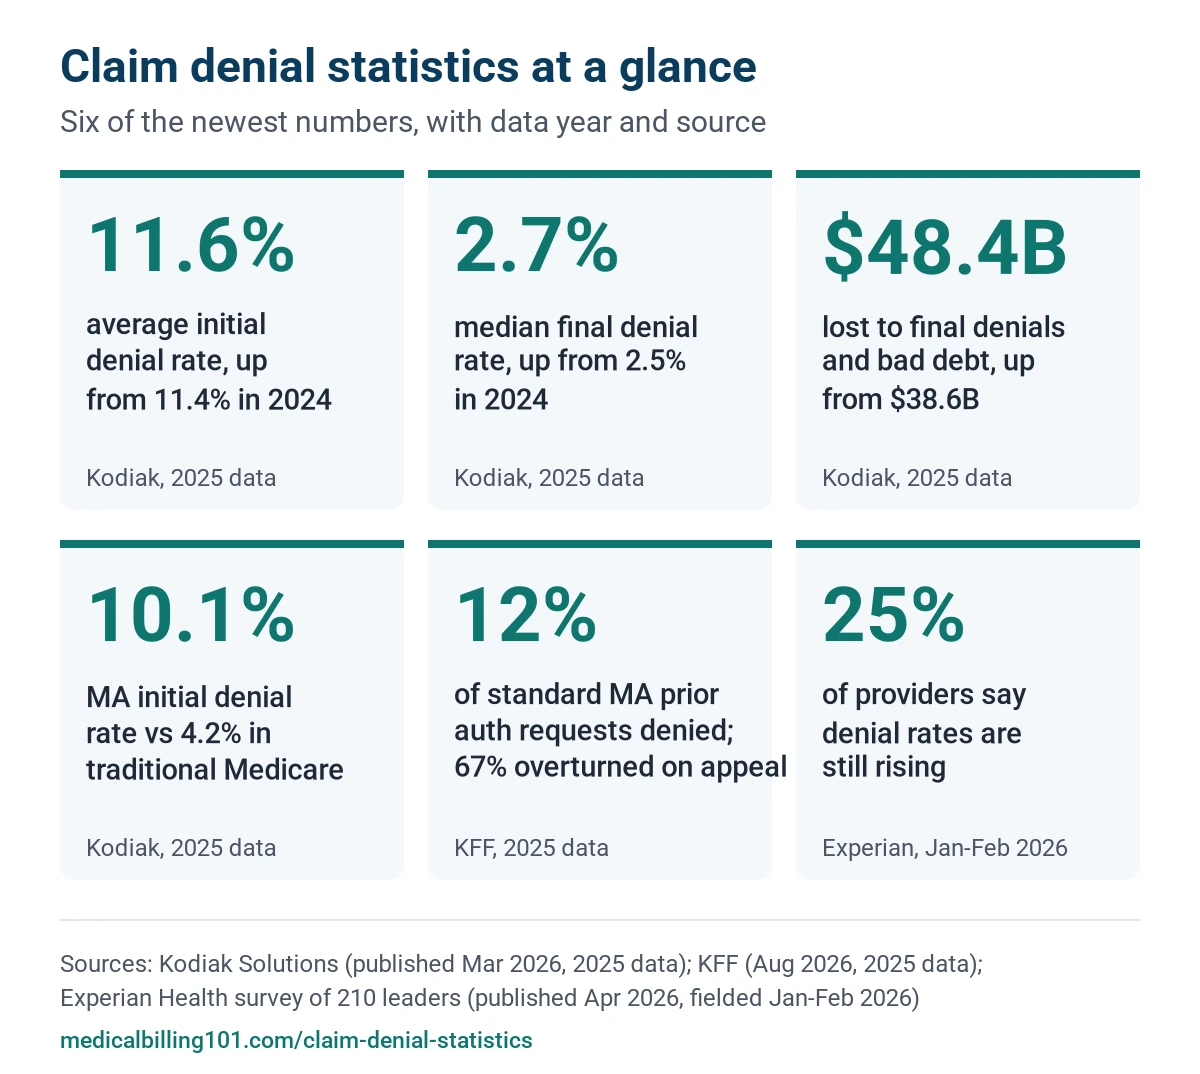
Quick answer: Denials rose in 2025. The average initial claim denial rate was 11.6%, up from 11.4% in 2024. The median final denial rate rose from 2.5% to 2.7% (Kodiak Solutions, published March 2026; 2025 data). Our simple projection puts 2026 at about 11.6% to 11.8% (Medical Billing 101 projection, October 2026). That range is an estimate, not measured data.
Claim denial statistics are easy to find and hard to trust. Many pages repeat old numbers with no year or link. This page leads with full-year 2025 data, then looks ahead to 2026. Each number links to its source and shows two dates: when it was published and what year the data covers. We checked every figure against the original source on 11 October 2026.
Key takeaways: claim denial statistics for 2025 and 2026
- 11.6% was the average initial denial rate for hospitals and physicians in 2025, up from 11.4% in 2024. (Kodiak, published March 2026; 2025 data)
- 2.7% was the median final denial rate in 2025, up from 2.5%. (Kodiak, published March 2026; 2025 data)
- $48.4 billion in net revenue was lost to final denials and bad debt in 2025, up from $38.6 billion. (Kodiak, published March 2026; 2025 data)
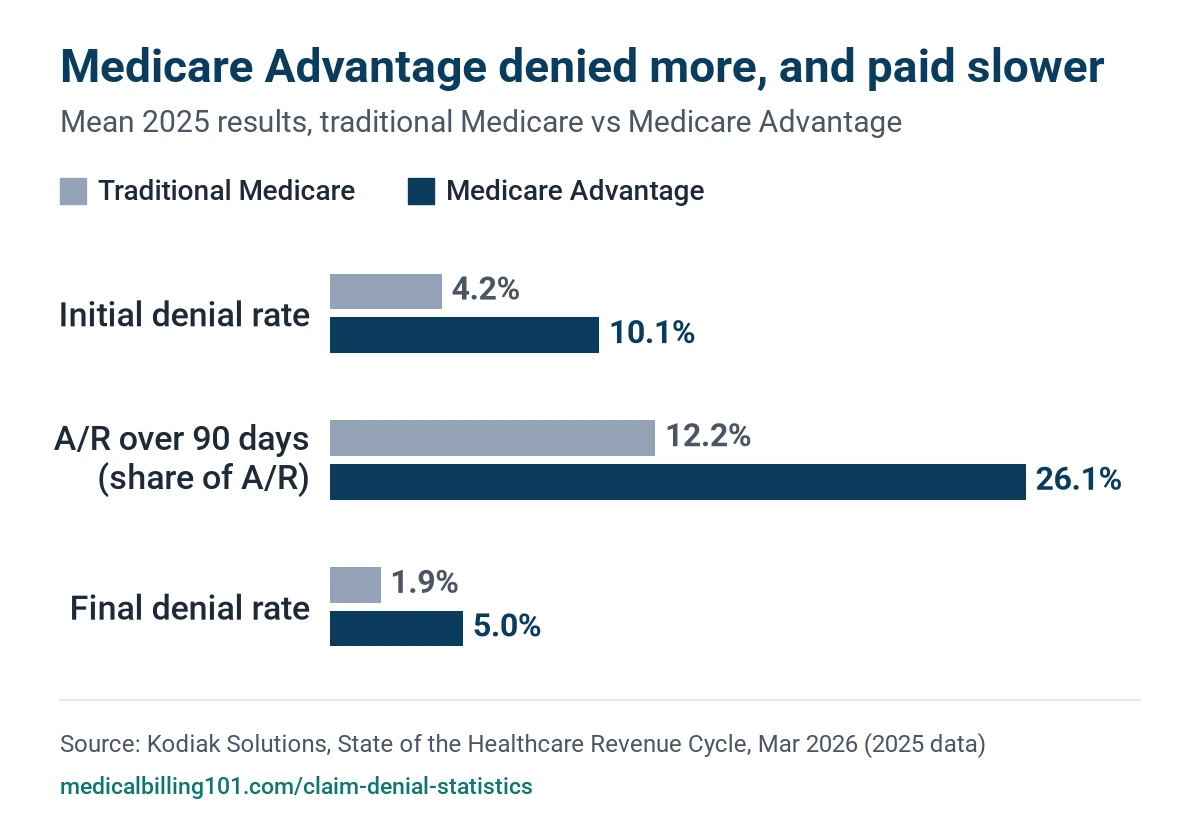
- 10.1% of Medicare Advantage (MA) claims were denied at first pass in 2025, compared with 4.2% in traditional Medicare. (Kodiak, published March 2026; 2025 data)
- 12% to 18% of standard prior auth requests were denied in 2025, depending on the program. In MA, 67% of appealed denials were overturned. (KFF, published August 2026; 2025 data)
- 25% of revenue cycle leaders say their denial rates are still rising, while 32% say they are falling. (Experian Health, published April 2026; survey fielded January and February 2026)
- 11.6% to 11.8% is our projected range for the 2026 initial denial rate. It is a simple trend line, not measured data. (Medical Billing 101 projection from Kodiak 2024 and 2025 data)
Before you quote a denial rate: what is being measured
Denial figures differ because sources count different things. Check three points before you compare two numbers.
- An initial denial is the payer’s first “no” on a claim. A final denial is what is still unpaid after resubmission and appeal. Kodiak reports both, so its 11.6% and 2.7% describe the same claims at two stages.
- Claims data or a survey. Kodiak, KFF and Optum count real claims or requests. Experian, Premier, MGMA and the AMA ask providers. A survey share, such as Experian’s 25%, is not a national denial rate.
- A prior auth denial is a “no” before care is given. A claim denial comes after. The KFF and CMS figures for 2025 are prior auth figures.
Claim denial rates in 2025
The newest full-year data comes from Kodiak Solutions. Its first “State of the healthcare revenue cycle” report covers 2,300 hospitals and 350,000 physicians that use its software. It compares 2025 with 2024 (Kodiak report PDF, published March 2026).
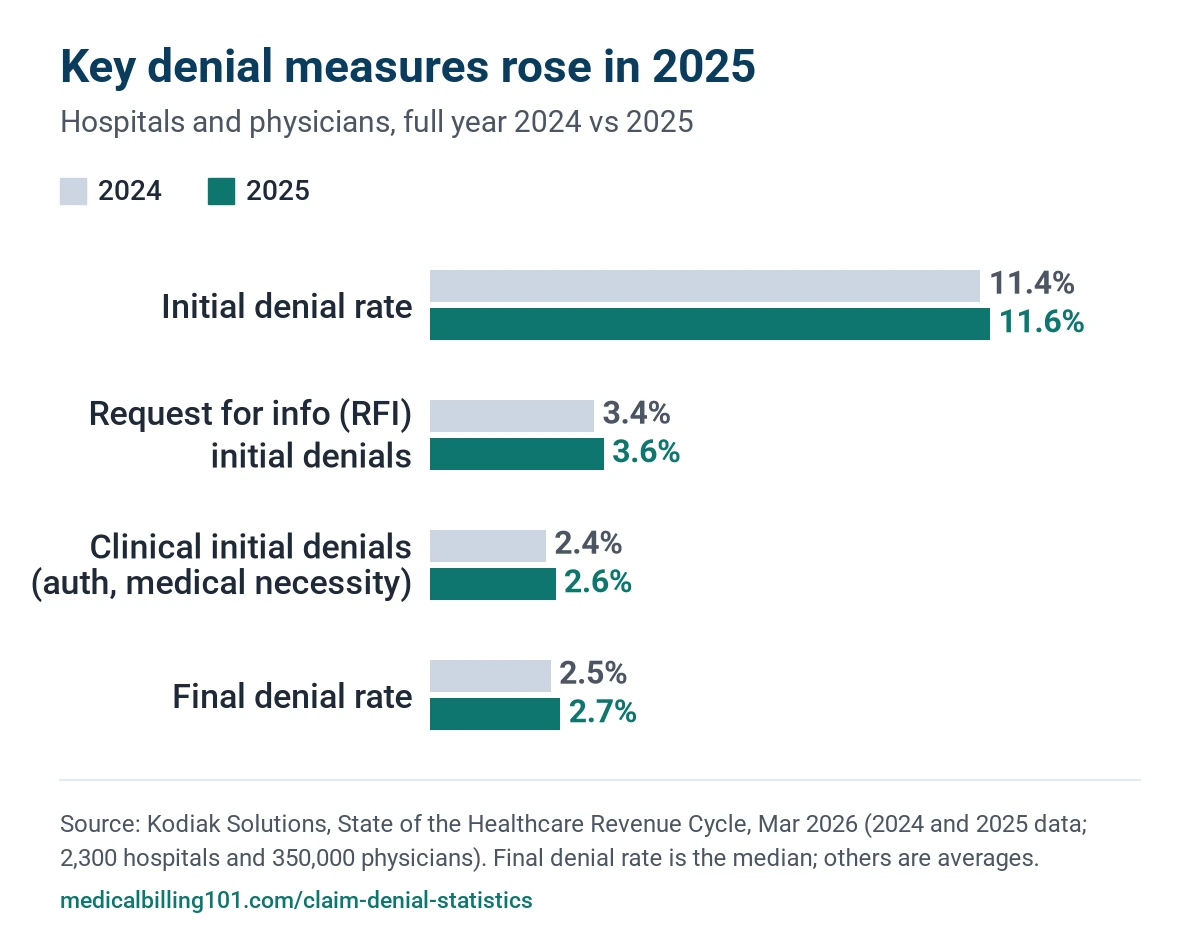
- Initial denials: 11.6% average rate in 2025, up from 11.4% in 2024. (Kodiak, published March 2026; 2025 data)
- Request-for-information denials: 3.6%, up from 3.4%. These are denials where the payer asks for more records. (Kodiak, published March 2026; 2025 data)
- Clinical initial denials: 2.6%, up from 2.4%. These are prior auth and medical necessity denials. Kodiak calls them “fatal” because they are hard to overturn. (Kodiak, published March 2026; 2025 data)
- Overturn rate: 42.1% of clinical initial denials were overturned in 2025, down from 42.7%. (Kodiak, published March 2026; 2025 data)
- Final denials: 2.7% median rate, up from 2.5%. The median bad debt rate rose from 1.1% to 1.3%. (Kodiak, published March 2026; 2025 data)
- Lost revenue: $48.4 billion in net revenue leakage, up from $38.6 billion in 2024. Kodiak defines leakage as final denials plus bad debt. (Kodiak, published March 2026; 2025 data)
- Faster payment: average time to insurance payment fell from 57.4 days to 55.2 days. Payers paid clean claims faster even as denials rose. (Fierce Healthcare, April 2, 2026; 2025 data)
Provider surveys from 2025 and early 2026 tell a mixed story.
- 25% of 210 revenue cycle leaders said their denial rates kept rising over the past year. Another 42% saw little change and 32% saw a decline. (Experian Health, published April 7, 2026; fielded January and February 2026)
- 41% of providers said 10% or more of their claims are denied, up from 38% in 2024 and 30% in 2022. (Experian Health State of Claims, published September 2025; 2025 survey)
- 48% of practice leaders named denials and appeals as their biggest revenue cycle leak. (MGMA Stat poll, published January 2026; 288 responses)
- 74% of physicians say prior auth denials have gone up over the past five years. (AMA survey, published May 2026; fielded December 2025)
Denial rates by payer type in 2025
Payer mix drives most of the gap between providers. Kodiak’s 2025 data shows initial and final denial rates for five payer groups. Medicaid had the highest inpatient initial denial rate at 44%, followed by commercial plans at 21% (Kodiak, published March 2026; 2025 data). MA denied 11% of inpatient and 9% of outpatient claims at first pass (Kodiak, published March 2026; 2025 data). Traditional Medicare had the lowest rates.
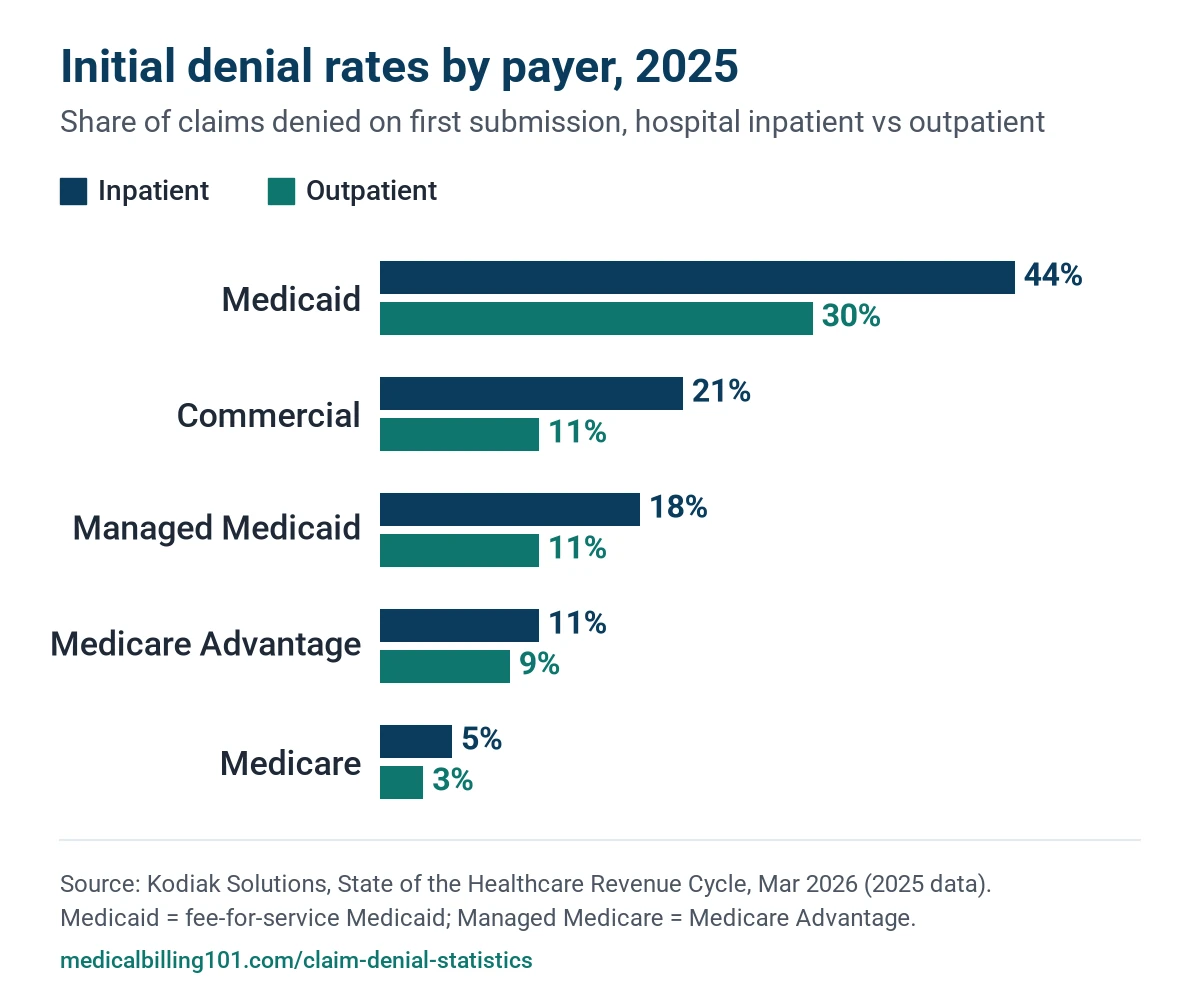
| Payer | Inpatient initial | Inpatient final | Outpatient initial | Outpatient final |
|---|---|---|---|---|
| Medicaid | 44% | 6% | 30% | 11% |
| Commercial | 21% | 3% | 11% | 3% |
| Managed Medicaid | 18% | 4% | 11% | 6% |
| Managed Medicare (MA) | 11% | 5% | 9% | 5% |
| Medicare | 5% | 1% | 3% | 3% |
For inpatient care across all payers, request-for-information denials rose more than 10% in 2025. Clinical initial denials rose more than 12% and final denials more than 14% (Kodiak, published March 2026; 2025 data). Kodiak notes that commercial inpatient denials cost the most, because those claims pay the most.
Medicare Advantage vs traditional Medicare
MA plans denied more than twice as often as traditional Medicare in 2025. They also paid more slowly (Kodiak, published March 2026; 2025 data).
- Prior auth in MA: insurers made 52.8 million prior auth decisions and denied 7.7% in full or in part. Only 11.5% of denials were appealed, and 80.7% of those appeals won. (KFF, published January 2026; 2024 data, the latest full-year MA series)
- ACA marketplace: HealthCare.gov insurers denied 19% of in-network claims and 37% of out-of-network claims. Rates ranged from 3% to 36% by insurer. (KFF, published March 2026; 2024 data, the latest available)
For Medicare appeal levels and deadlines, see how to appeal a denied Medicare claim.
Prior authorization statistics for 2025
2025 is the first year insurers had to post prior auth metrics under the CMS rule. KFF read those reports for MA, Medicaid managed care and the federal ACA marketplace (KFF, published August 2026; 2025 data).
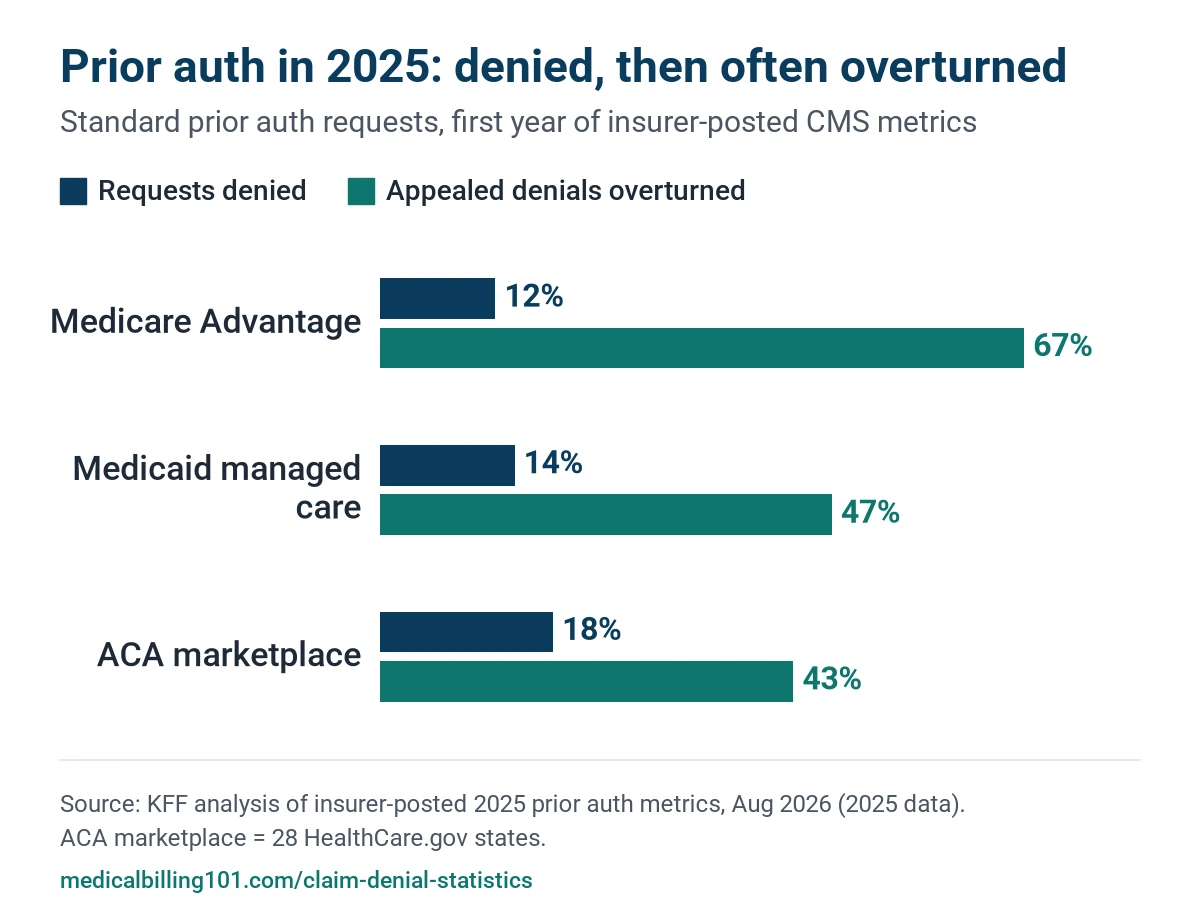
- Standard requests denied: 12% in MA, 14% in Medicaid managed care and 18% in the ACA marketplace. Expedited requests were denied at 10%, 12% and 16%. (KFF, published August 2026; 2025 data)
- Insurers differ a lot. For example, UnitedHealth denied 17% of standard MA requests, 11% in Medicaid managed care and 21% in the marketplace. (KFF, published August 2026; 2025 data)
- Physician workload: doctors complete 40 prior auths a week, which takes 13 hours of physician and staff time. (AMA, published May 2026; fielded December 2025)
- Care delays: 95% of physicians say prior auth delays needed care, and 26% report a serious adverse event. (AMA survey, published May 2026; fielded December 2025)
- AI worries: 60% of physicians are concerned that AI increases or will increase prior auth denials. (AMA survey, published May 2026; fielded December 2025)
If a request is denied, our guide on what to do after a prior auth denial covers the next steps.
Appeal rates and success rates
The newest data shows the same pattern as older studies. Few denials are appealed, but many appeals succeed.
| Setting | Share appealed | Outcome | Source (published; data year) |
|---|---|---|---|
| Clinical initial claim denials, hospitals and physicians | Not reported | 42.1% overturned | Kodiak (Mar 2026; 2025) |
| Standard prior auth, MA / Medicaid MCO / ACA marketplace | Not reported | 67% / 47% / 43% overturned | KFF (Aug 2026; 2025) |
| Medicare Advantage prior auth | 11.5% | 80.7% partly or fully overturned | KFF (Jan 2026; 2024) |
| MA skilled nursing facility admission | 18% | 95% overturned | HHS OIG (Jun 2026; June 2024) |
| MA long-term care hospital / inpatient rehab | Not reported | 36% / 43% overturned | HHS OIG (Jun 2026; June 2024) |
| ACA marketplace claims (in-network) | Fewer than 1% | 66% upheld by insurer | KFF (Mar 2026; 2024) |
[Unique insight] OUR ANALYSIS
In 2025, denials rose while payment got faster. Kodiak found clean claims were paid sooner, yet clinical denials grew and fewer were overturned (Kodiak, published March 2026; 2025 data). Our read: the easy claims are getting easier, and the hard ones are getting harder. Appeals still pay off. In 2025, plans overturned 43% to 67% of appealed prior auth denials (KFF, published 2026; 2025 data). For most billing teams, the best return is a short list of clinical denials worth a strong appeal.
Many denials are not appealed at all. They are fixed and sent again as corrected claims. Our corrected claim resubmission guide explains when to correct and when to appeal.
Top denial reasons in 2026 and the CARC codes behind them
The newest ranking comes from a survey, not claims data. Experian Health asked 210 revenue cycle leaders which denials are the easiest to prevent (Experian Health, published April 2026; fielded January and February 2026).
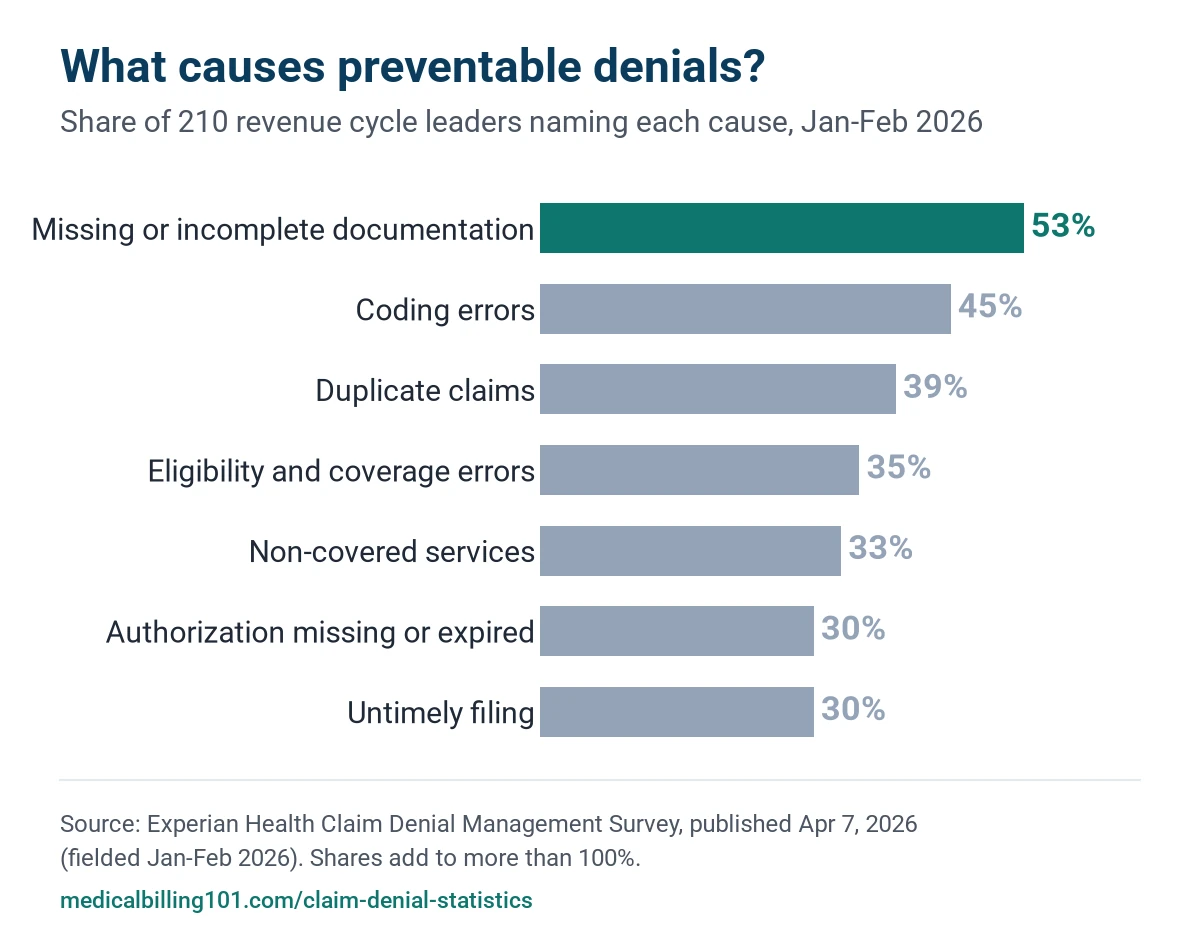
Missing or incomplete documentation topped the list at 53%, and coding errors came next at 45% (Experian Health, published April 2026; 2026 survey). Half of the leaders (50%) named front-end accuracy as a top way to cut denials. Staff training came next at 42% (Experian Health, published April 2026; 2026 survey).
Latest available claims-based ranking (data year 2023). No newer national claims study ranks denial causes. In Optum’s hospital data, the top causes were as follows (Optum 2024 Denials Index, published 2024; 2023 data). The CARC column is our own guide, not part of the Optum data.
| Denial category | Share of denials | Common CARCs to check |
|---|---|---|
| Registration and eligibility | 24.33% | CO-27, CO-31, CO-109, CO-22 |
| Missing or invalid claim data | 15.89% | CO-16 |
| Authorization and precertification | 12.80% | CO-197 |
| Medical documentation requested | 12.08% | CO-252 |
| Service not covered | 9.67% | CO-96, PR-204 |
| Medical necessity | 6.76% | CO-50 |
New to remittance codes? Our CARC and RARC guide explains how group codes, reason codes and remark codes fit together. You can also browse every code in our denial code library. Bundling edits are not their own category in these datasets, but coders see them every day. See CO-97 (procedure included in another service). For a plain list of causes, see the most common claim denial reasons.
Claim denials in 2026: what to expect
No full-year 2026 data exist yet. The chart extends the measured 2024 and 2025 rates with a simple trend. The shaded area is a projection, not measured data.
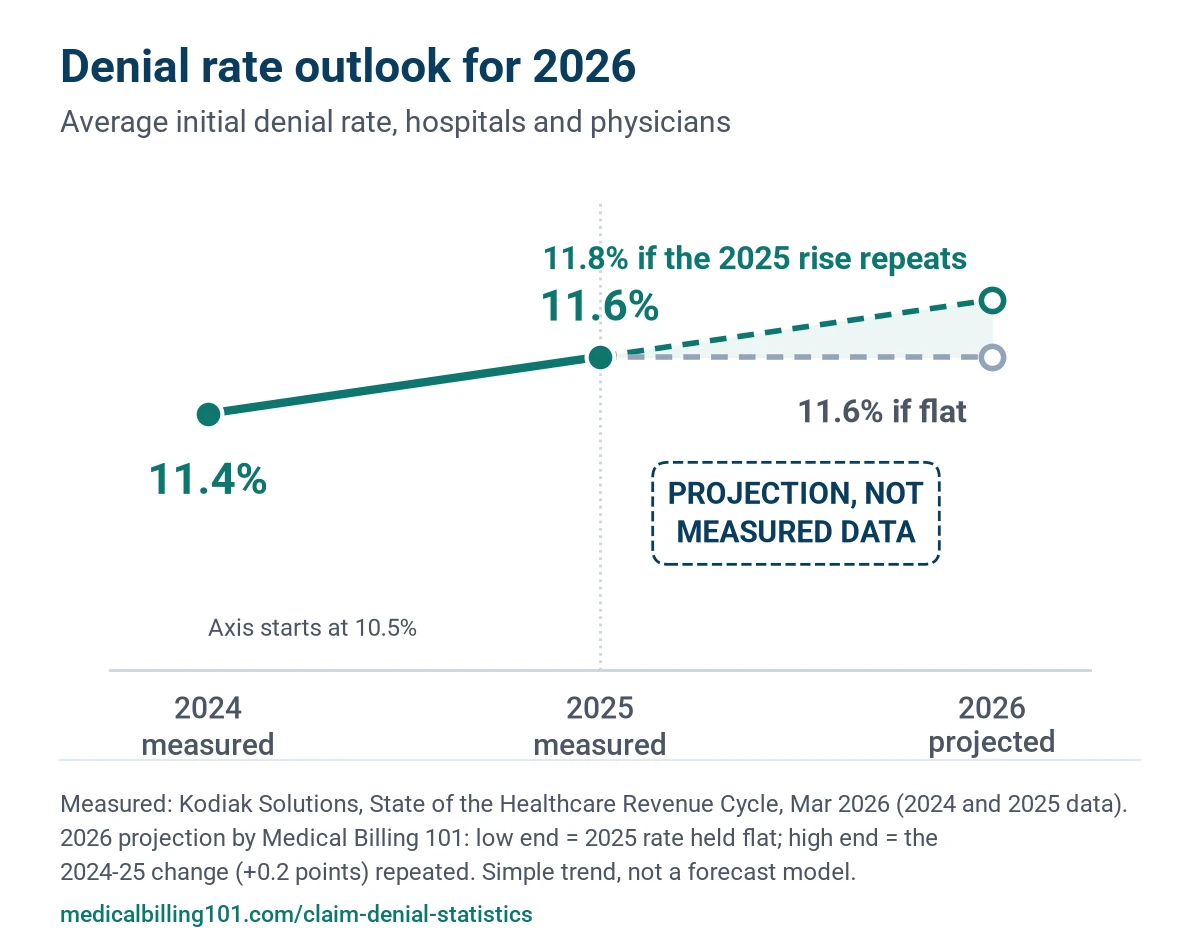
How we built the projection. We used only the two full-year points from the same Kodiak report: 11.4% for 2024 and 11.6% for 2025. The low end holds 2025 flat at 11.6%. The high end repeats the 2024 to 2025 change of 0.2 points, which gives 11.8%. This is a straight line through two points, not a forecast model.
Assumptions behind the range:
- Kodiak’s provider mix and definitions stay the same in 2026.
- Payers keep acting as they did in 2025.
- The range does not model the policy changes below. They could push the rate up or down.
- A separate Kodiak reading showed a similar rise, from 11.41% in 2024 to 11.65% for January to November 2025 (HFMA, published January 2026). We did not mix those numbers into the line, because the basis differs.
What may push denials up or down in 2026 (each item is the source’s view or a scheduled rule, not a promise):
- Clinical denials are expected to keep rising. Kodiak said clinical denials were still rising in early 2026. It added that providers are “increasingly being asked to ‘prove’ medical necessity” (Kodiak’s Matt Szaflarski in Fierce Healthcare, April 2, 2026).
- WISeR adds prior auth to Original Medicare in six states. The CMS model runs from January 1, 2026, to December 31, 2031, in New Jersey, Ohio, Oklahoma, Texas, Arizona and Washington. Vendors use AI with clinician review for services such as skin substitutes, nerve stimulator implants and knee arthroscopy. This may add prior auth or pre-payment denials for those services. (CMS WISeR model page, 2025 to 2026)
- Faster, clearer prior auth decisions under CMS-0057-F. Since January 1, 2026, impacted payers must decide expedited requests within 72 hours and standard requests within 7 days. They must give a specific reason for each denial. A Prior Authorization API is due by January 1, 2027. These rules are expected to speed decisions, but it is not yet known whether they cut denial volume. (CMS fact sheet, published January 2024)
- The insurer prior auth pledge. In June 2025, health plans pledged to cut the number of services that need prior auth by January 1, 2026. In April 2026, AHIP reported that 11% of prior auths had been removed, or 6.5 million fewer. In MA the cut was more than 15%. (AHIP, June 2025; AHIP update, April 2026) These are the industry’s own figures. Only 33% of physicians expect the pledge to make a real difference (AMA, published May 2026; fielded December 2025).
- AI claim reviews face court and physician scrutiny. A class action says UnitedHealth relied on AI tools to deny MA post-acute care claims. A federal court let contract claims go forward in February 2025, and the case was still in discovery in October 2026. (Georgetown Health Care Litigation Tracker, updated October 1, 2026) The outcome may shape how plans use AI in reviews.
- Medicaid changes under the 2025 budget law (OBBBA). States must start Medicaid work requirements by December 31, 2026. Expansion adults will also face eligibility checks every six months, for renewals on or after that date. (KFF summary, updated August 2025) Kodiak expects these changes to increase self-pay (Fierce Healthcare, April 2026). More coverage churn may also mean more eligibility denials, mostly from late 2026 on.
What this means for billers
Practical view from Manikandan J, CPC, CRCR
Read together, the 2025 numbers trace one path, from a clean claim to money lost. The chart shows one sourced number for each step.
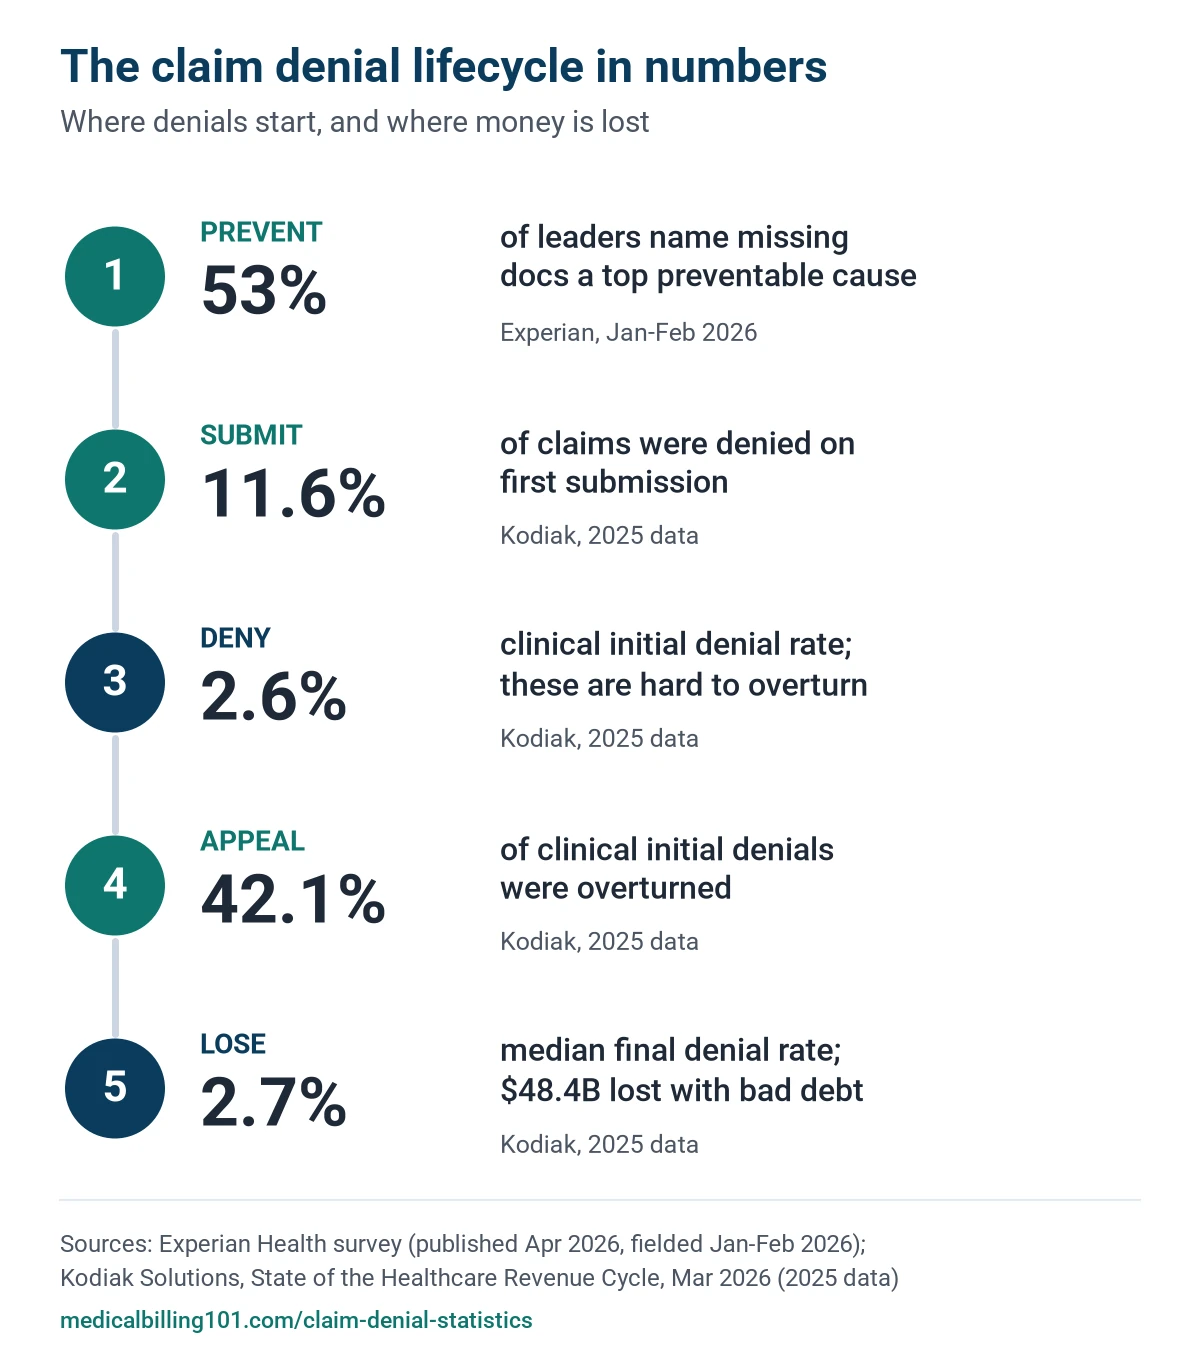
- Fix documentation and data at the front end. Simple checks stop many CO-27, CO-31 and CO-22 denials before they happen. For example, check eligibility before the visit, match the member ID to the card and confirm any other coverage.
- Build a medical necessity packet for clinical denials. These grew fastest in 2025 and are the hardest to win. Send the notes, orders and payer policy that support the service with the first claim, not only on appeal.
- Appeal more often. Plans overturned 43% to 67% of appealed prior auth denials in 2025, yet few denials are appealed. A denial that is never appealed becomes a final denial.
- Fix data errors instead of appealing them. CO-16 and similar data denials usually need a corrected claim, not an appeal letter. Save appeals for medical necessity (CO-50) and coverage disputes.
- Track your own denial rate by payer and reason code. Watch MA and Medicaid most closely, since they had the highest 2025 rates. Our denial tracking dashboard guide shows one way to set this up.
Older benchmarks still cited (data before 2024)
These figures are the latest available for their measure. We keep them for context and show each data year.
- Cost to rework: hospitals spent an average of $57.23 per claim fighting denials, and $80.16 for MA claims. (Premier, published February 2025; 2023 data; Premier letter to CMS, April 2025; 2023 data) MGMA has cited $25.20 per reworked claim for practices (MGMA, published 2021; data year not stated).
- Total cost: Premier estimates providers spent $25.7 billion on claims review, and calls about $18 billion of it likely needless. (Premier, published 2025; 2023 data)
- Avoidable denials: 84% of hospital denials could have been avoided, by Optum’s count. (Optum, published 2024; 2023 data)
- Hospital denial trend: Optum’s hospital initial denial rate rose from 9% in 2016 to 12% in 2023. (Optum, published 2024; 2016 to 2023 data)
- Private payers: nearly 15% of hospital claims were initially denied, and 68.6% of denied claims were paid in the end. (Premier, published 2025; 2023 data)
- MA claims study: 17.7% of MA claims were denied at first submission. Providers never resubmitted 40% of those denials. (Health Affairs, published June 2025; 2019 data)
- Payer comparison study: MA had the highest inpatient denial rate (20.0%), and Medicaid managed care the highest professional rate (15.1%). (Health Affairs Scholar, published August 2026; 2019 data)
- OIG sample: 13% of MA prior auth denials met Medicare coverage rules. (HHS OIG, published April 2022; June 2019 sample)
Methodology
- We used only primary or original sources. These include federal agencies (CMS, HHS OIG), KFF, peer-reviewed journals, professional groups (AMA, MGMA, HFMA, AHIP) and named industry reports (Kodiak Solutions, Experian Health, Premier, Optum).
- We opened each figure in the original report and checked it word for word on 11 October 2026. Every figure shows when it was published and what year the data covers.
- We lead with 2025 data. Where no 2024 or 2025 source exists for a measure, we show the latest available figure lower on the page, with its data year.
- We used the Kodiak March 2026 report for both 2024 and 2025, so the two years share one method. Earlier Kodiak releases used other bases, so we did not mix them in.
- Survey results describe the groups that answered and may not represent all providers. Kodiak’s data covers providers on its own platform.
- The 2026 range is the only value on this page that we did not take straight from a source. Its method and assumptions are shown above. All other chart values are the published numbers.
Sources
How to cite this page
You are welcome to use any statistic or chart on this page. Please cite the original source shown next to it, and link to this page as the place you found it. If you use the 2026 range, call it a projection.
Suggested citation: Manikandan J. “Claim Denial Statistics 2026.” Medical Billing 101. Updated 11 October 2026. https://medicalbilling101.com/claim-denial-statistics/
Link to this page:
<a href="https://medicalbilling101.com/claim-denial-statistics/">Claim Denial Statistics 2026 (Medical Billing 101)</a>Embed the infographic:
<a href="https://medicalbilling101.com/claim-denial-statistics/"><img src="https://medicalbilling101.com/wp-content/uploads/2026/10/claim-denial-statistics-key-numbers-2025.webp" alt="Claim denial statistics at a glance, 2025 data" width="1200" height="1074"></a>Frequently asked questions
What is the claim denial rate in 2025?
The average initial claim denial rate was 11.6% in 2025, up from 11.4% in 2024 (Kodiak Solutions, published March 2026; 2025 data from 2,300 hospitals and 350,000 physicians). The median final denial rate rose from 2.5% to 2.7%. Medicare Advantage denied 10.1% of claims at first pass, compared with 4.2% in traditional Medicare.
Will claim denials rise in 2026?
No full-year 2026 data exist yet, so no one can say for sure. Kodiak said in April 2026 that clinical initial denials were continuing to rise. If the 2024 to 2025 change simply repeats, the average initial denial rate would reach about 11.8% in 2026. If it holds flat, it stays at 11.6%. That range is our own projection, not measured data. New rules may push in both directions, such as the CMS WISeR prior auth model and the insurer prior auth pledge.
What percentage of denied claims are appealed?
Very few. KFF found that fewer than 1% of denied in-network ACA marketplace claims were appealed (published March 2026; 2024 data, the latest available). In Medicare Advantage, 11.5% of denied prior auth requests were appealed (published January 2026; 2024 data).
How often do denial appeals succeed?
Often, in most settings. In 2025, 67% of appealed standard prior auth denials were overturned in Medicare Advantage, 47% in Medicaid managed care and 43% in the ACA marketplace (KFF, published August 2026; 2025 data). Kodiak found that 42.1% of clinical initial claim denials were overturned in 2025 (published March 2026).
What is the most common reason claims are denied?
Front-end data problems. In a survey from early 2026, 53% of leaders named missing or incomplete records as a top cause they could prevent (Experian Health, published April 2026). Next came coding errors, at 45%. The latest claims-based ranking is older: in Optum’s 2023 data, registration and eligibility caused 24.33% of hospital denials (published 2024).
How much does it cost to rework a denied claim?
The latest figure is from 2023 claims. Hospitals reported an average of $57.23 per claim to fight denials, and $80.16 for Medicare Advantage claims (Premier, published 2025). Kodiak puts total net revenue lost to final denials and bad debt at $48.4 billion in 2025 (published March 2026).
Last updated: 11 October 2026. This page is for education. Denial rates vary by payer, specialty and contract, so use these figures as context, not as a benchmark for any one practice. The 2026 range is a projection, not a prediction.